How to forecast tourism demand with Google Trends & Data Studio?
The year 2020 was a shocking one for the tourism industry. Inbound travel plunged and predicting when tourism demand will recover is difficult. This study shows you how you can forecast the recovery of European markets by using Google Trends data in a Google Data Studio dashboard. A number of sample dashboards that can help you decide when to start up marketing campaigns and how to forecast revenues are included as well.
Contents of this page
1. Why should you do online market research and forecasting?
Market research will help you understand your target markets and create campaigns that wow your audience, because you understand who they are and why they travel. You can use statistics and forecasting to understand the current market situation and identify business opportunities. Forecasting will help you anticipate changes in demand that occur during high and low seasons or during a recovery that comes after a crisis. It will also help you to set SMART goals to guide and measure the success of your marketing activities and plan your business resources.
Figure 1: SMART goals
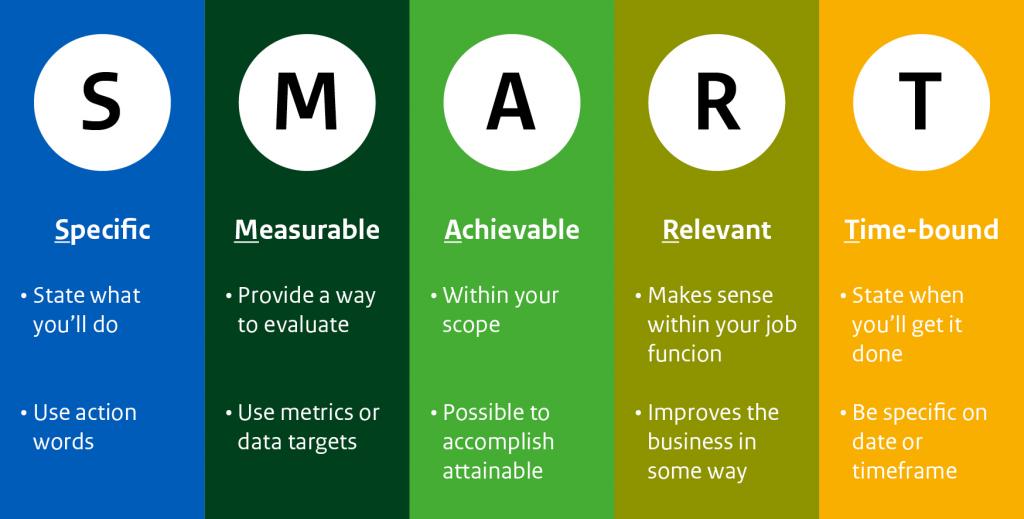
Source: CBI (2020)
2. Why use Google Trends and Data Studio to forecast tourism demand?
Google Trends is an online tool by Google that shows the popularity of top search queries in Google Search across various regions and languages. Data Studio is a free tool from Google that helps visualise a wide variety of data from Google's services and other external sources with bar graphs, charts, line graphs, geo maps, and more.
The Centre for the Promotion of Imports from developing countries (CBI) has created a number of Data Studio dashboards to help you understand demand and recovery during the COVID-19 crisis in the biggest European outbound markets. These dashboards, like the examples depicted in Figure 2, indicate recovery of domestic travel by monitoring the volume of searches for key terms like “AirBnB” and “Hotels”, and outbound recovery by monitoring the volume of searches for key terms like “Flights” and popular destinations like “Hotel Bali”.
Figure 2: Search terms “hotels” and “flights” in the UK
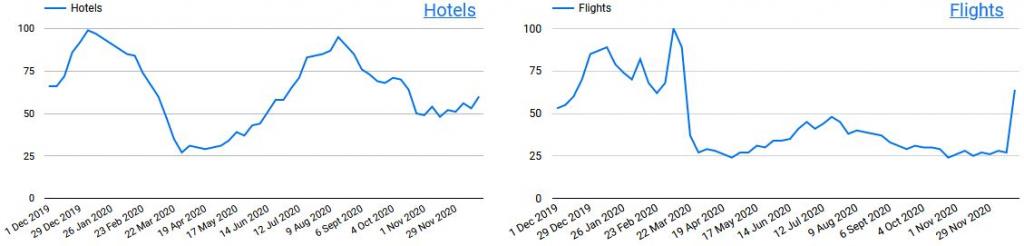
Source: CBI Data Studio dashboard (2020)
When should you use the CBI tourism dashboards?
The dashboards can be used bi-weekly or monthly to monitor the trends in your target markets. Big coronavirus news about vaccines, lockdowns or the opening-up of a destination could be reasons to check the dashboard more often. When the high season is about to start in your destination, you can also use the dashboard to see in which markets the volume of searches is already rising.
3. Which dashboards are available?
There are a total of 19 pre-defined CBI dashboards available that provide an insight in the largest source markets and a number of specific tourism trends.
Click the links in the table below to go to the dashboard you need:
Outbound tourism market dashboards:
Domestic travel recovery:
Regional travel recovery:
Long Haul travel recovery:
Recovery of people who are ‘in the mood’ to book:
Recovery of different Holiday Types:
4. Learn how to use and adapt dashboards to your needs
To help you get the most out of the CBI tourism dashboards, we have created 2 instruction videos. The first video gives an in-depth overview on how to use them. You will learn which searches indicate demand for domestic, outbound, and long-haul travellers. In the second video, you will learn how to change and add countries and search terms that help you customise the dashboard to get the best insights for your destination or tourism product.
- Link to video 1: How to use the dashboard
- Link to video 2: How to change the dashboard
Lastly, CBI has also created a comprehensive quick reference guide, where you can find all the important links.
Tip:
- To change the dashboard and use it for your own organisation, please go to the Strategiq website and follow steps 1 and 2 to register for your own API key.
The API to connect with Google trends is made by Strategiq.
VTP Digital Marketing carried out this study on behalf of CBI.
Please review our market information disclaimer.
Search
Enter search terms to find market research